So if you are reading this article you probably have at least one lung and you know how to breathe, what if I tell you that the forex market has lungs as well? in fact it has quite big lungs.
The only difference from a human being is that instead of breathing oxygen the markets breaths sell orders and exhales buy orders.
So how can this concept make you money?
You have been in a quiet room with somebody sleeping or anyway somebody relaxed and suddenly you were able to predict the end of their inhalation and the beginning of their exhalation. You can do this because in an harmonious state the breathing follows a natural pattern and a natural rhythm. The same concept applies to the markets where a smooth market or a trending market is harmonious and follows a natural pattern. And in the opposite it is very difficult to do it when somebody is in an out of control or volatile or directionless state, right?
A trending market is quite easy to trade, the trend is the harmonious state of the market that makes price predictable, and of course volatile markets are most of the time non-predictable because of their non-natural style of breathing.
So enough dwelling around, if you are a trader you surely heard the phrase “the trend is your friend”, well that is true but incomplete, why? because the trend is your friend half of the time and the other half is your worst enemy,
Notice in these picture how the exhales out in the direction of the trend and inhale against the dominant trend.
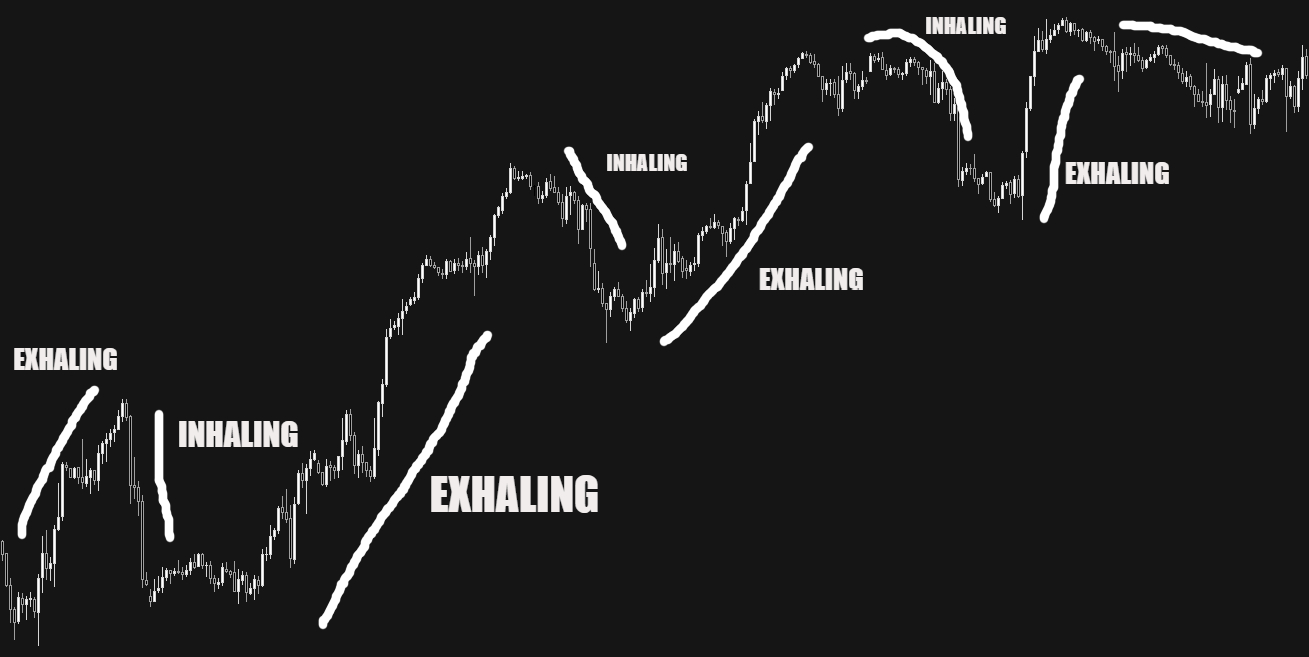
So the concept behind this is well known, it’s basically the classic EMA bounce or trendline bounce, but we are going to add a multi-timeframe type of filter, basically, we start on the daily chart and we figure out in which phase we are in, there are two phases:
Phase 1 exhalation and Phase 2 inhalation, notice these charts:
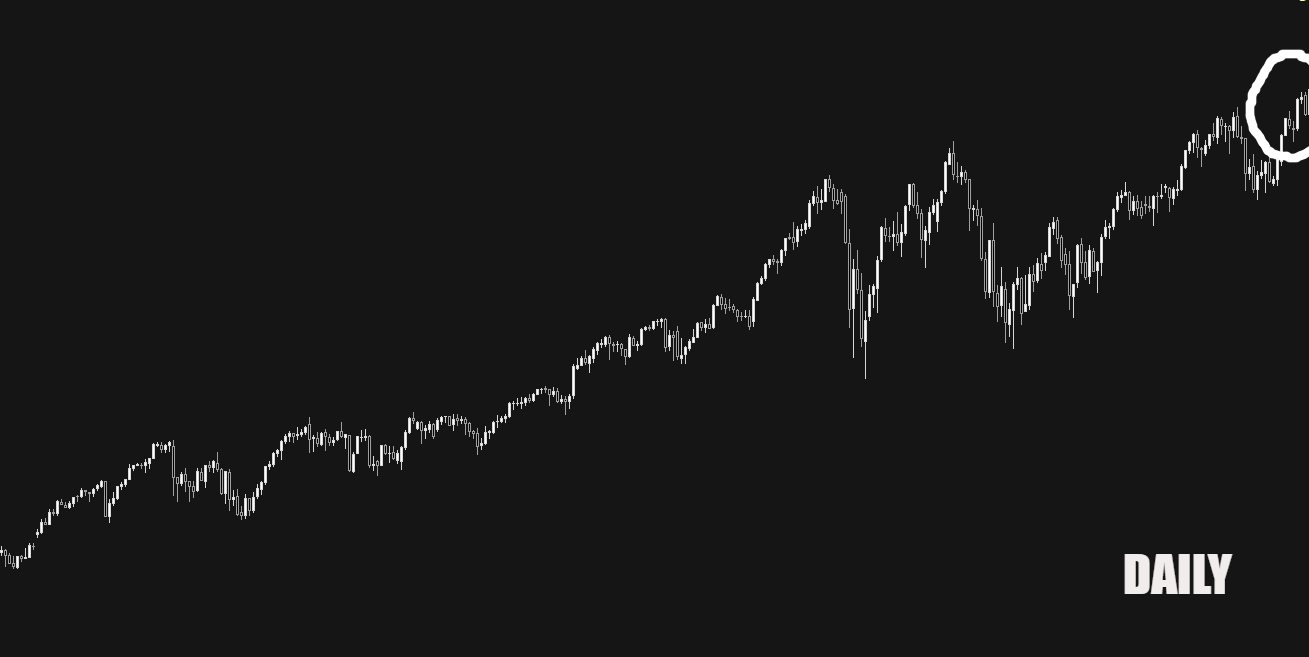
The daily chart
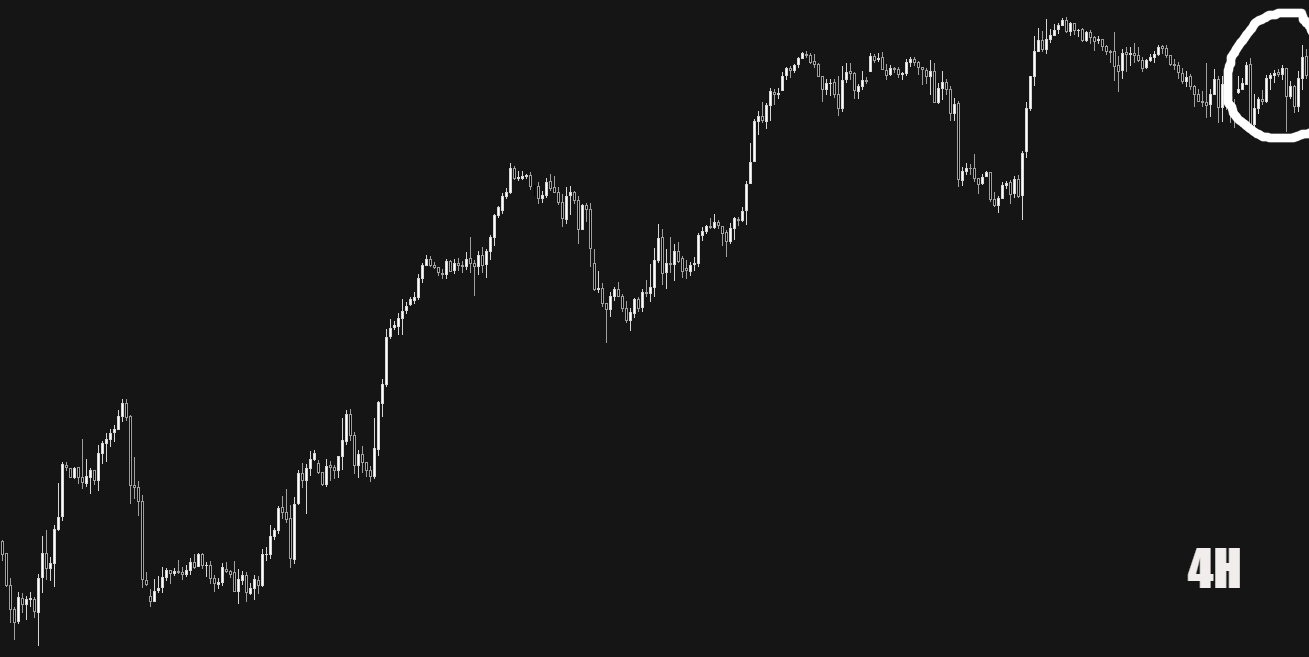
The 4 hour chart
And the 1 hour chart
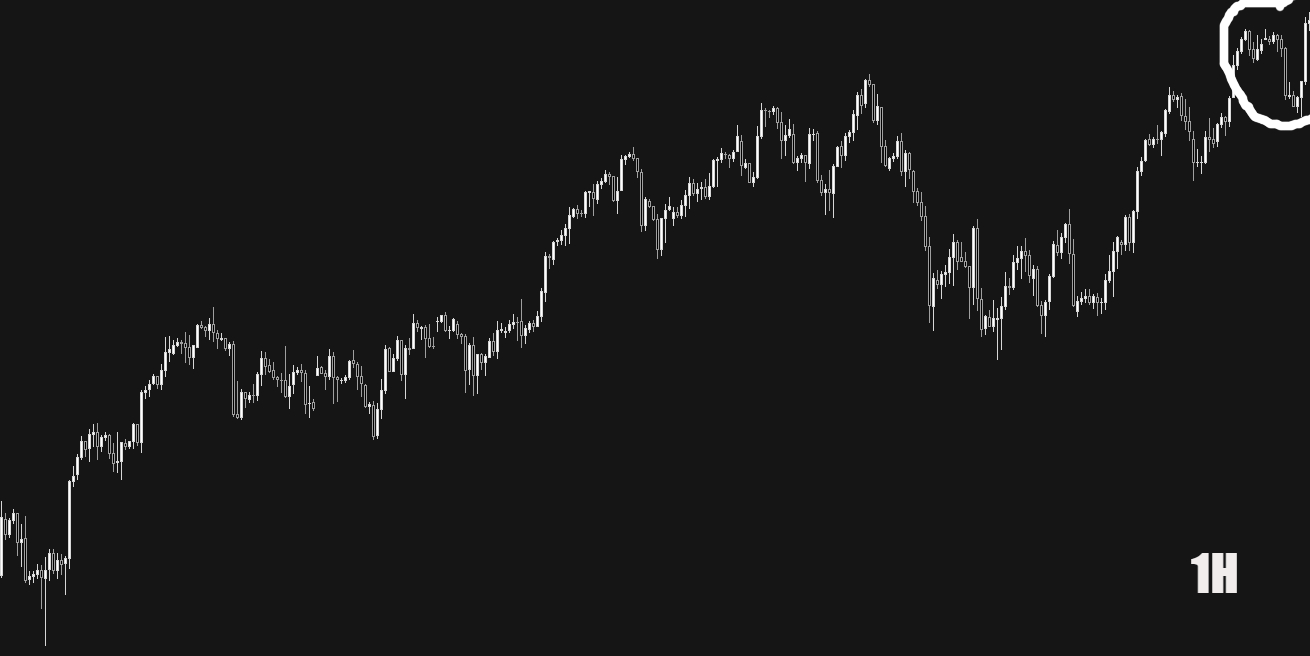
All shows us that we are in an exhalation phase and so it’s a nice pair to trade, now that you found the well-behaving chart you can wait for a nice pullback to the trendline or to a 200 EMA or simply open a position at the break of the closest resistance (in uptrend) support (in downtrend).