BESOMEBODYFX

HISTORY AND TRADING?

Trades
besomebodyfx
HOW HISTORY CAN HELP US IN OUR TRADING?
Some of you may find this post very boring and some of you will find it extremely valuable and informative, so i’m writing this for all the market nerds like myself that love this stuff, but if you aren’t one then give it a read anyway.

What I want to talk about is how history can help us in our trading and how we can study it to help us approach future similar events in the right way.

It may be a little boring at first but hold on until the end because there are a few gold nuggets for your trading and there is a great opportunity that you can capitalize in the near future 😉


So let’s get started…

First the “boring” part for most of the traders that are reading this.

In the US the biggest panic narrative was of course in 1929 and i’m sure you all studied it in school right?… Right?

Well, it was the 1929 market crash that gave us the notion of indeed the word “crash”, before that the phrase “boom and crash” was used only in relation to something else like the sound of thunder or whatever was appropriate in the historical period.

But the ‘29 crash completely changed the human perspective and the main significance of the word “crash” which from then on it was related mainly to the stock market.

And of course we all know this came back various times since then, we have 2001 and 2008 as the most recent examples, not to mention 2020 crash.


Yes but then what’s the point?

These narratives that happened years and even almost a century ago can be useful to read current events…

If we want to have a better understanding of what’s happening in a specific period of time we are living, then we always need to recognize that we are often experiencing a slight mutation of the most similar historical event.


Did I lose you already? 

Well speaking about crashes, what i’m trying to say is that the human mind can be very pessimistic and sadic in these periods because most people want to see the world burn, they want to see the end of “world order”, the end of the markets as well all know it and so on…

I find very interesting how aggressively most people are extrapolating the current situation (COVID19) out into the forever future.

It’s similar to how people were talking about the market in 2008 and in 2001.

The consensus was: “The market is toast.” “Nobody will want to invest in stocks again”.

Since then, well we all know how well the US stock market performed.

Pessimistic biases tend to be magnified aggressively after a salient, scary thing like COVID19 happens.

We tend to project the current circumstances out forever when in real life the world often reverts or goes off in a completely different direction more quickly than one could possibly imagine when still living in the middle of the scary thing.

The markets are forward looking by at least 6 months so they can and they will “price in” the recovery much earlier than what everybody would expect.

And we are not hypothesizing here, the world has encountered many many many many apocalyptic events that the majority thought would have signed the end of capital markets, but nope so far the world hasn’t ended, it always gets back up, over and over again, probably we have a lot to learn from it.

And history teaches us this, humans tend to exaggerate the conclusions and while the majority is pessimistic and believes the world will end after a certain event a few smart investors load up positions anticipating the world getting back on its feet and the market recovering like it always did for the past century at least.

We all want to be the next Michael Burry (who?) and bet on the market collapse but for every 1 investor that capitalized on a crash there are 10 that created wealth from buying cheap, who has the advantage here?

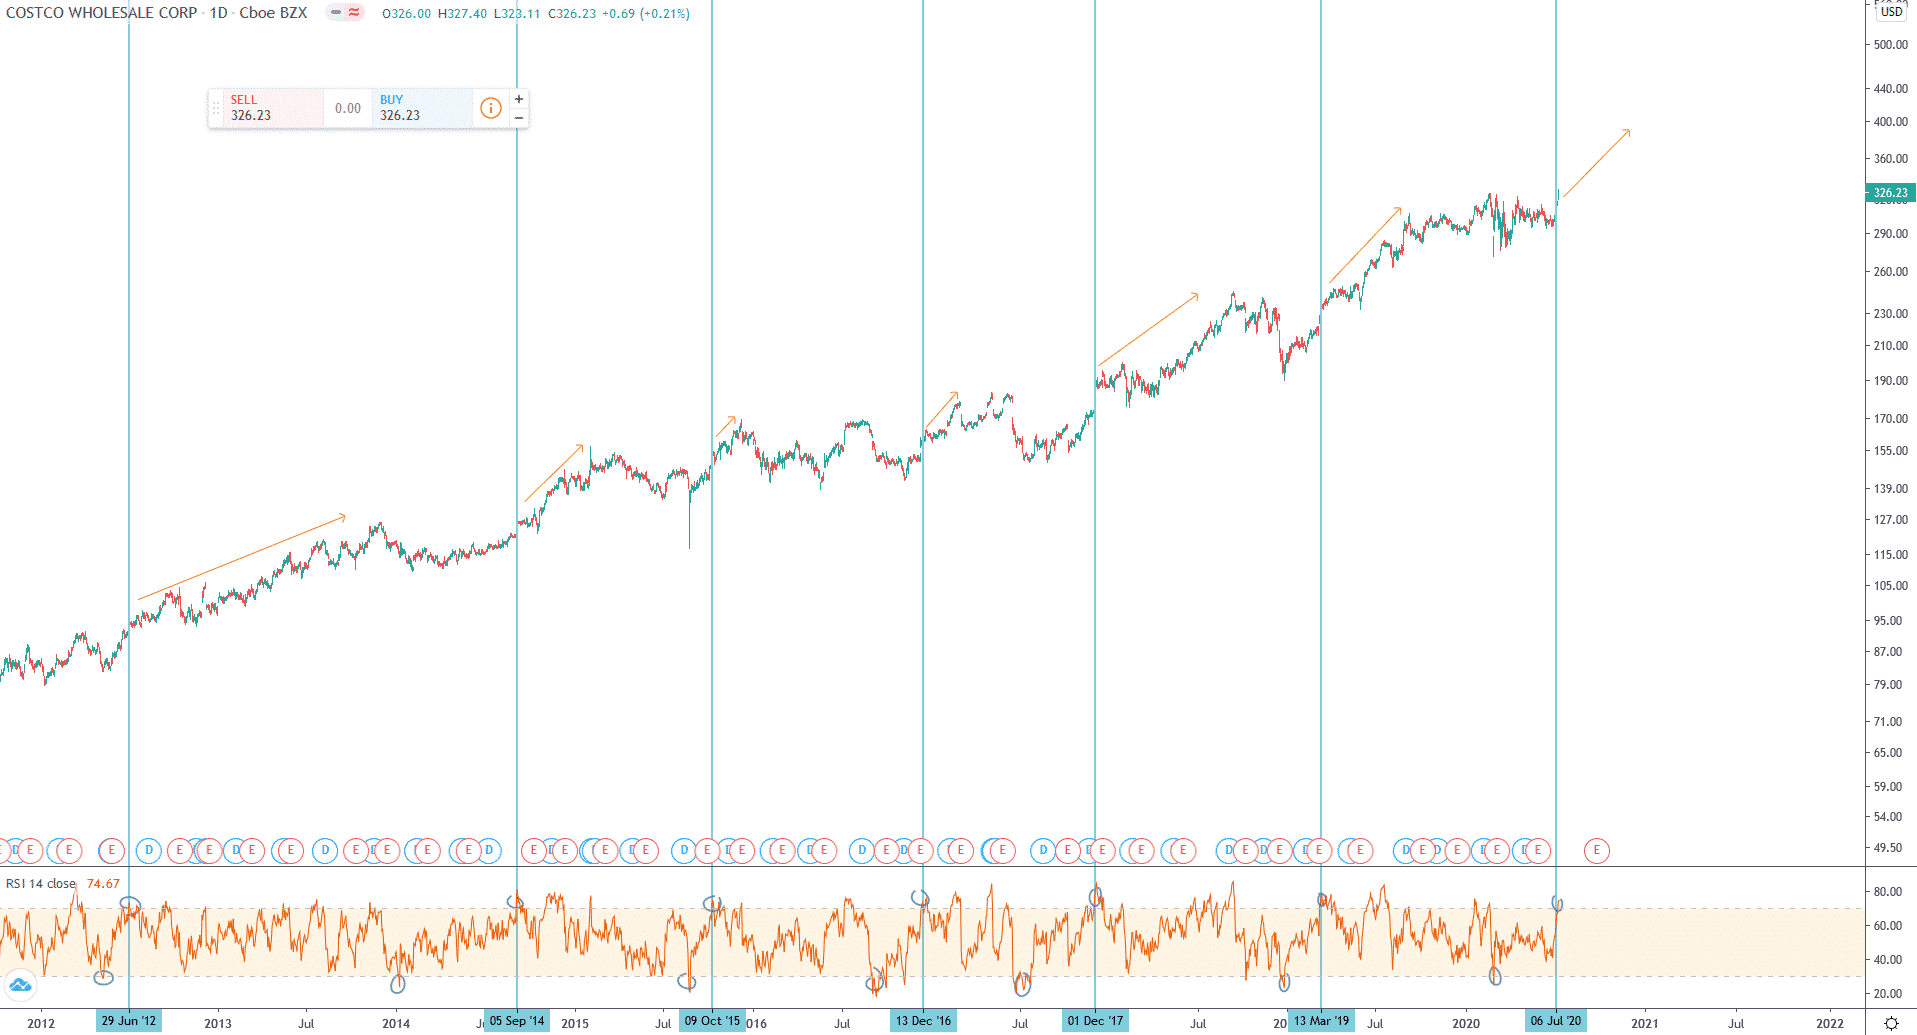
I’m not saying you to buy every dip but i’m saying you that its wise to do what worked in the past and so far buying the dips has worked very well, you just need to build a tool that helps you doing that and helps you time well the entries and we personally did it very well, you can check it here.


But how do you do that?

Well I can’t give you the all the sauce here but I can point you in the right direction, and a good start is studying leading indicators (not the indicators you are thinking of… leading indicators are economic indicators that lead the lagging indicators) like PMIs (especially the ISM in the US), Building Permits and Consumer Confidence (University of Michigan Consumer Sentiment in the US)

I can guarantee you that it’s not hard and if you squeeze your brain a little you will find the answer on how to buy the dips after a crash in those three indicators.


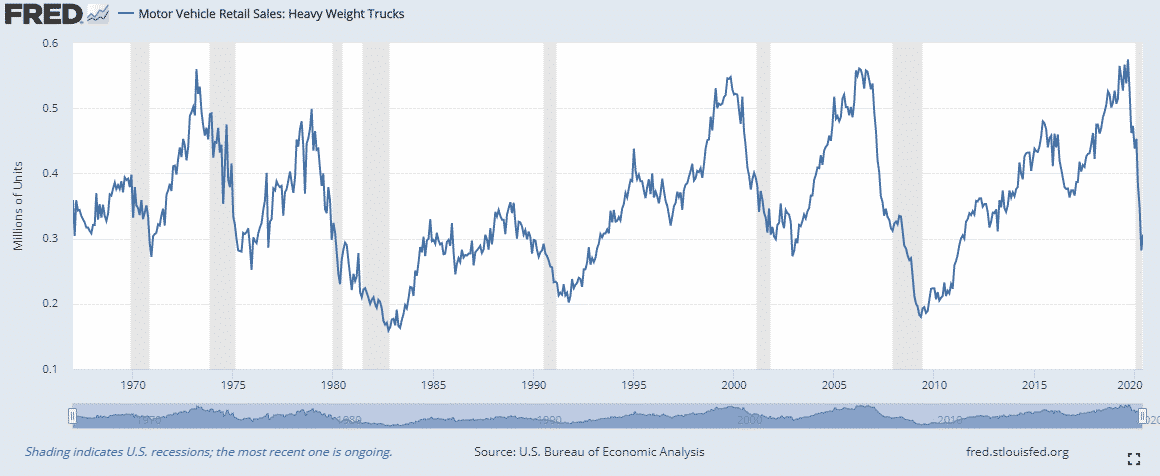
And my favorite, Heavy Truck Sales:

The grey shaded parts are US recessions, do you see what i’m seeing?

Well i hope you do, here is a tweet we sent a while ago (pre COVID crash)

The stock market moves on GDP expectations for the next 6 to 12 months, so learn to predict GDP (lagging indicator) by studying leading indicators and you will have a great advantage in long term investing, i have said enough 😉


What else?

This is the most straight forward and simple example i can do relative to the US stock market performance but by studying historical events and the impact they had on the economy (keeping a close eye on leading indicators) we can be better prepared for what the future might throw at us in every sector, stocks, currencies, commodities and so on.

And it doesn’t stop here because this concept doesn’t apply only to historical events, we are talking about chart patterns as well…

Always ask yourself if “A” is happening what usually follows? as in what happened after “A” in the past year or decade depending on your timeframe?

You may find out that you have a solid pattern to trade on, and sometimes it may even go against everything you have been taught by the instagram and youtube furus out there. 


Here is a recent example that we are looking to trade on.

This is COST, and you will find in this chart that the first time the RSI goes overbought after being oversold price tends to rally in the following months, and yes this is the bonus for all the curious readers that made it until here you can buy COST hereand hold for a few months until satisfied with the profit.

Is this just random?

Of course it is, everything is random but there can be order in randomness as well, what we rely on, in this case, is in the concept of “When A happened then B followed X% of the times in the past X years”, there isn’t, of course, a guarantee that B will happen but what we have a few odds in our favor if it worked in the past.

So as you can see this concept of studying history and how a certain event impacted price on the chart can be applied in both real historical events and technical formations on the charts as well.

On the technical side sometimes you may just be trading the right pattern but in the wrong asset, let’s take a classic bearish/bullish flag pattern for instance.

It’s a great pattern that can be extremely profitable if put into context, so sometimes you just need to do some chart work and see how many times in this specific currency pair, commodity or stock a bull flag worked well? you may scroll on your chart and see that 8 flags out of 10 didn’t work in that asset, so would you still trade it?

Of course not, history is proving you that in that specific asset that specific pattern doesn’t work or at least recently didn’t work well.

At the same time you may find that price after breaking the flag usually spikes on the opposite side to stop hunt all the breakout traders before following in the intended direction, so what would you do in this case? would you still buy right at the breakout or would you buy the stop hunt to get the best entry price possible?

And on the opposite is true as well, you may find out in a specific asset that 8 times out of 10 when price broke a flag it never came back to retest the broken flag, so when the next flag breaks will you look to trade the retest or will you enter a position right at the break?

Exactly a few minutes ago while i was writing this article a friend of mine was looking to buy a specific stock at the NY open, the stock gapped up and he asked me “what do i do now?” “do i buy here or wait for the gap to fill?”

The answer is easy, there is no fixed rule, the rule will change for every asset, just look at some chart history and see at least in the past 10 gaps how many times price filled it and how many times it just run away?

It filled the gap 7 times out of 10? good then wait for the gap to fill before buying…

Price usually never fills the gap and just runs away leaving it open? good then don’t wait for the gap to fill…


Tons of examples can be made here, it’s all about getting used in looking at how the chart reacted when event “X” happened which could be the FED going 0% interest rates, a global pandemic, RSI going overbought, a technical breakout of a flag or resistance and so on… You may find very interesting results.

I hope this little article was informative, have a great day and stay safe out there.


Cheers,

Jay from the BeSomebodyFX Team